Lab 5: Analysing trained networks
Today, you will first install the programme 'R', which is a free software environoment for statistical computing and graphics. R is great for doing statistics, but it is especially wonderful for exploring data visually: something that is of far more value than the generation of meaningless t-tests and ANOVAs. You can get R from this website. Download it and install it in a convenient location on your machine.
It will be to your advantage to learn a bit about R, and to become familiar with its many strengths. But we do not have time to make you experts in this lab. Any R code you need will be provided here. But if there is demand, I am happy to provide further training in using R to anyone who wants. You can also find many self-paced tutorials on the web. The Documentation section of the R website is a good place to start.
Last week, you trained networks using the "duoPart.pat" set of patterns. These are all possible 4-bit vectors, bar two (<0,1,0,0> & <0,1,0,1>). The network was trained to classify these into two classes: those with exactly two "on" bits, and all the others. Today we will use hierarchical clustering to examine the solutions the network found.
- Train a 4-3-1 network to correctly classify the "duoPart.pat" set of patterns. Check to see if it generalizes. Does it get the missing Patter 5 correct? How about missing Pattern 6?
- Once you can characterize the behaviour of the network, save the hidden unit activations using "Utilities→Export hidden unit activation". This will dump the hidden unit activations into a file. Have a look at the file. It is hard to interpret, isn't it? Make a note in your notebook about how the network did. You might like to save the weights too, in case you want to examine the network further.
- Repeat until you have found networks that generalize to one or both missing patterns, and one that does not generalize at all. Save the hidden unit activations for each, and keep notes!
- Fire up R, and set the working directory to be whereever you saved the hidden unit activations. This is under the "Misc" menu for me on a Mac.
- In the console window, type in the following series of commands. Do not type in lines beginning with a '#'. They are comments, just to tell you what is going on. I saved my actications into a file called "activations.dat". You will have to use your own file name, of course.
# Lets read in the activations  We store them in a variable called "acts"
acts <- read.table("activations.dat")

# Now calculate all pairwise Euclidean distances
d <- dist(acts, method="euclidean")

# Use those to calculate hierarchical clusters
fit <- hclust(d, method="ward.D2")

# Display the results
plot(fit)
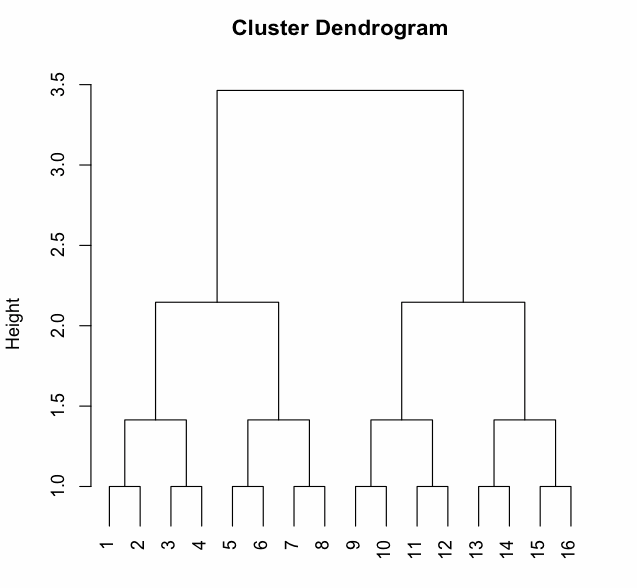
If you do this on the input patterns (here you go), you get the figure below, in which you can see that every pattern is like every other pattern. At the hidden layer, though, this should look very different.

Do this for a network that generalizes, and one that does not generalize. Can you see from the cluster plot why one works and one doesn't?
In order to interpret the tree you have generated, draw up a table (pen and paper). Make 2 columns, one headed by "1" and one headed by "0". Go to the list of patterns (Lab 4), and make a note of which patterns should produce an output of 1 (that's Patterns 4, 6, 7 etc) and which should produce an output of 0. You might also note which of the patterns that generate a 0 have less than two units on, and which have more.
Now, using your table, inspect the cluster diagram you got. Does it make sense? How many groups are there? Did this network "understand" the problem in the same way you did? Did it identify two classes, or more? How do patterns 5 and 6 fare? Try your best to interpret the cluster diagram as one way of representing the solution that the network found.
A little practice with R
Here are two short tutorials that introduce you gently to R. Work through them at your own pace. The exercise at the end of the first one is entirely optional.
If you like cluster analysis, you might like to try out some further methods. R has lots. Details here.
